DIA-NN 2.0 and tsv file output
From version 2.0, DIA-NN stops producing output in the tab-delimited text format (.tsv). It uses the parquet data format. In our experiments, a .parquet file output is about 10 times smaller than the equivalent .tsv file. If your downstream processing tool requires a .tsv file as input, you can convert a .parquet file to .tsv file using the R package arrow.
require("arrow")
# if the package "arrow" is not available, you can install it by
# install.packages("arrow")

write.table(arrow::read_parquet("report.parquet"), "report.tsv",
            sep = "\t", row.names = FALSE, quote = FALSE)
DIA-MS quantification at the fragment level
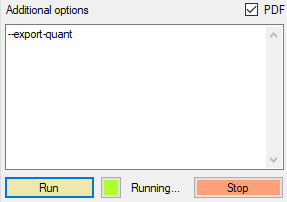
For protein quantification using MS/MS fragments, one needs to switch on the --export-quant flag
The fragment intensities will be in the .parquet file columns Fr.0.Quantity, Fr.1.Quantity, and so on till Fr.11.Quantity. We can combine all quantitative information in a new column called Intensities as input to the iq R package.
raw <- arrow::read_parquet("report.parquet")

raw$Intensities = paste(raw$Fr.0.Quantity, raw$Fr.1.Quantity, raw$Fr.2.Quantity,
                        raw$Fr.3.Quantity, raw$Fr.4.Quantity, raw$Fr.5.Quantity,
                        raw$Fr.6.Quantity, raw$Fr.7.Quantity, raw$Fr.8.Quantity,
                        raw$Fr.9.Quantity, raw$Fr.10.Quantity, raw$Fr.11.Quantity, sep = ";")

write.table(raw, "report.tsv", sep = "\t", row.names = FALSE, quote = FALSE)
We can then process the resulting report.tsv file using iq.
iq::process_long_format("report.tsv",
                        output_filename = "report-protein-group.txt",
                        sample_id = "Run",
                        intensity_col = "Intensities",
                        annotation_col = c("Protein.Ids","Protein.Names", "Genes"),
                        filter_double_less = c("Q.Value" = "0.01", "PG.Q.Value" = "0.05",
                                               "Lib.Q.Value" = "0.01",
                                               "Lib.PG.Q.Value" = "0.01"))
A smaller tsv file
You can also just store necessary columns for iq processing, or filtering out fragments that will not be used, or both.
raw <- arrow::read_parquet("report.parquet")

raw$Intensities = paste(raw$Fr.0.Quantity, raw$Fr.1.Quantity, raw$Fr.2.Quantity,
                        raw$Fr.3.Quantity, raw$Fr.4.Quantity, raw$Fr.5.Quantity,
                        raw$Fr.6.Quantity, raw$Fr.7.Quantity, raw$Fr.8.Quantity,
                        raw$Fr.9.Quantity, raw$Fr.10.Quantity, raw$Fr.11.Quantity, sep = ";")

selected <- raw$Q.Value < 0.01 & raw$PG.Q.Value < 0.05 &
            raw$Lib.Q.Value < 0.01 & raw$Lib.PG.Q.Value < 0.01

raw <- raw[selected, c("Run", "Protein.Group", "Precursor.Id", "Precursor.Normalised",
                       "Protein.Ids","Protein.Names", "Genes", "Intensities")]

write.table(raw, "report-trimmed.tsv", sep = "\t", row.names = FALSE, quote = FALSE)

iq::process_long_format("report-trimmed.tsv",
                    output_filename = "report-protein-group-trimmed.txt",
                    sample_id = "Run",
                    intensity_col = "Intensities",
                    annotation_col = c("Protein.Ids","Protein.Names", "Genes"),
                    filter_double_less = NULL)
Open a big tsv file with Excel
Usually not a good idea. A big .tsv file is not suitable for Excel. I often look at the head of the file to check if the headers are ok.
# On Unix-like systems
head report.tsv > report-head.tsv
# On Window PowerShell
gc report.tsv -head 10 > report-head.tsvThe resulting file report-head.tsv can be easily opened by Excel for examination.